
PHOTO
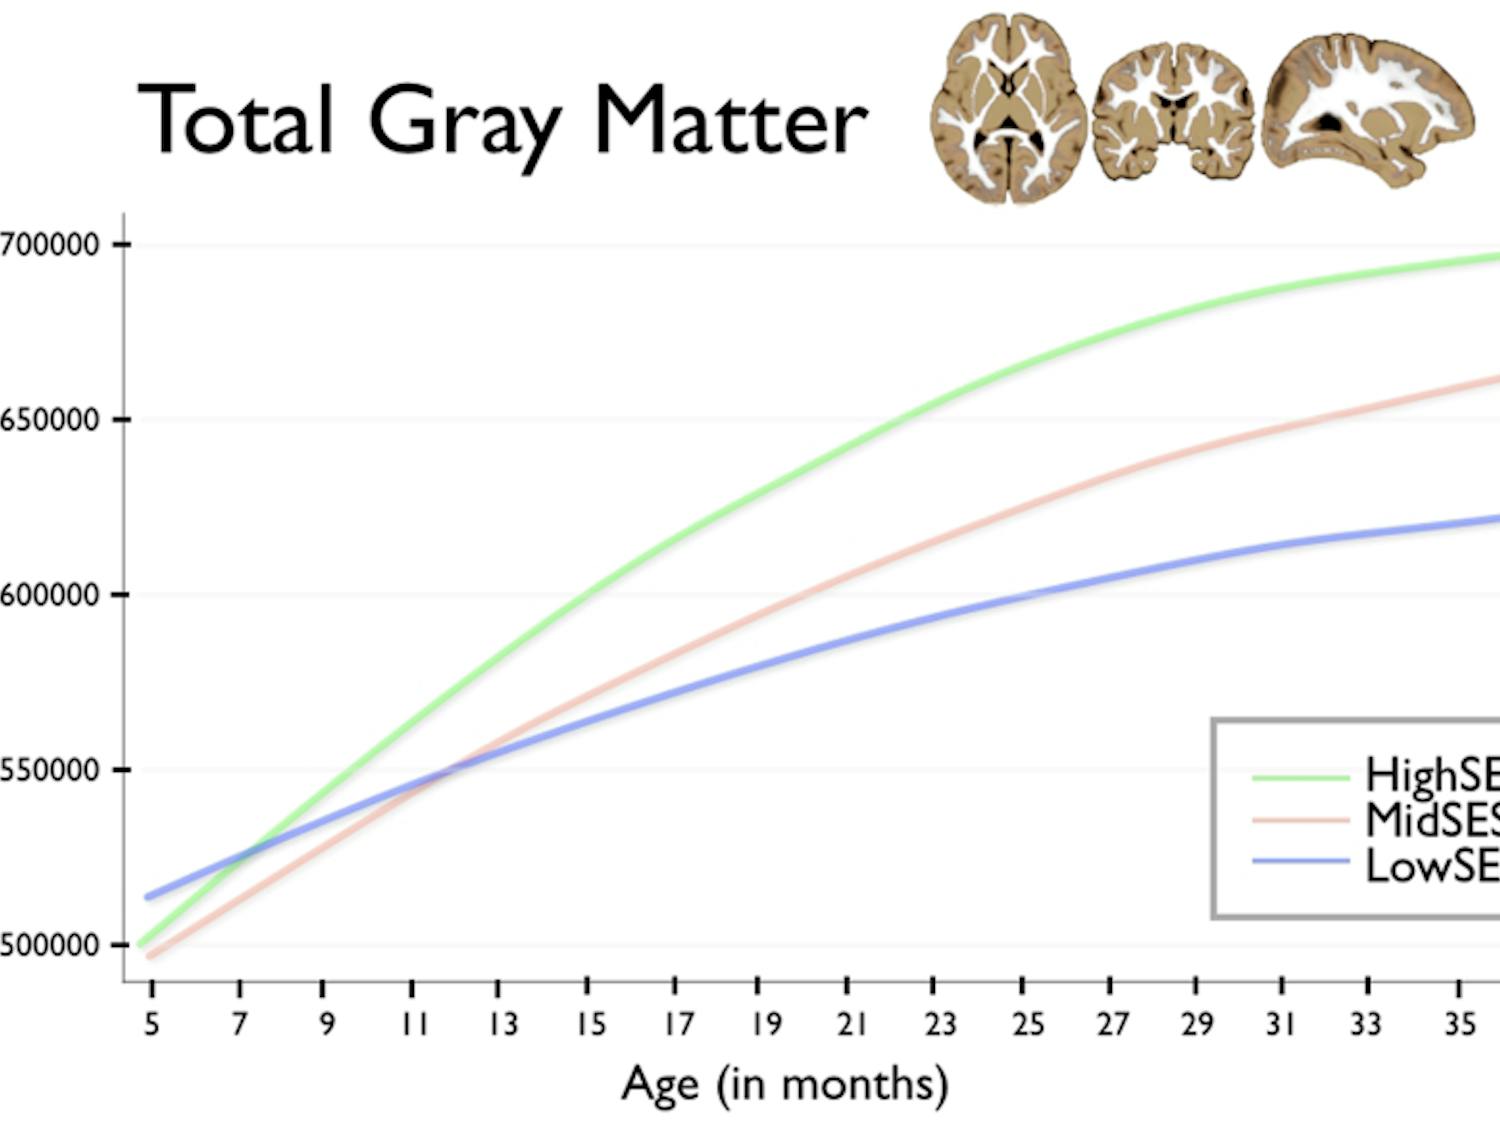
Total Gray Matter
By Courtesy of PLOS One | Feb. 18, 2014This figure displays the total gray matter for each income group by age. Low income households are represented by the blue line, middle income households by the red line and high income households by the green line.
